- A similarity matrix is a matrix of scores which express the similarity between two data points.
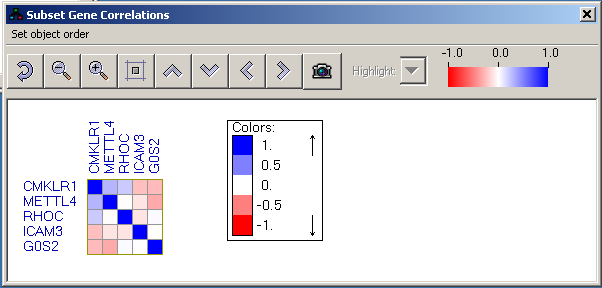
-This display shows correlations/co-occurrences between two groups of objects, or between objects belonging to the same group. One group of objects is presented as the rows of the similarity matrix and the other as the columns. The matrix cells are color-coded based on the similarity values. Blue indicates positive values and red negative ones. The scale of the colors is -1..1 by default, but if the similarity values exceed this region, the thresholds are scaled such that full blue and red colors represent the 90% percentile of the value range.

No comments:
Post a Comment